
Optimal Solar and Battery Allocation (Sezibwa)
[!info] Conservative, bank-facing basis (revised after independent review) Turnkey installed capex and real day-to-day weather (seeded variable-irradiance year). These are the numbers a lender should see.
Headline
Sweeping both dimensions (solar size and battery capacity) to find the allocation with the best 20-year return gives a clear, slightly counterintuitive answer:
The most business-optimal allocation is solar-heavy and battery-light. Put the money into panels on the battery already owned. Adding battery capacity lowers the return.
- No feed-in (today): about 5 kWp on the existing 8.9 kWh battery. Turnkey capex about 6.3M UGX, payback about 2.2 years, IRR about 45 percent, 20-year NPV about 10.8M UGX.
- With feed-in (if net metering arrives): about 8 kWp on the same battery. Capex about 10.1M, payback about 2.1 years, IRR about 48 percent, NPV about 19.6M.
- In both, buying a second or third battery unit lowers NPV.
Method
A 2-D sweep over solar (0 to 8 kWp) and battery (existing one unit, or plus one or two SR-SE10B units). For each combination the model runs the real load through 20 years and computes discounted savings minus turnkey capex.
| Assumption | Value |
|---|---|
| Horizon | 20 years |
| Battery aging | usable capacity fades linearly to 50 percent by year 20 |
| Panel aging | 0.5 percent per year |
| Weather | seeded variable-irradiance year (real day-to-day spread) |
| Discount rate | 15 percent (also shown at 22 percent) |
| Solar capex | about 1.26M UGX per kWp turnkey |
| Extra battery capex | 5.568M UGX per SR-SE10B (8.9 kWh usable) |
| Existing inverter + 1 battery | sunk (9.4M already spent) |
| Feed-in | none (base), or surplus sold at 343 UGX/kWh |
Result
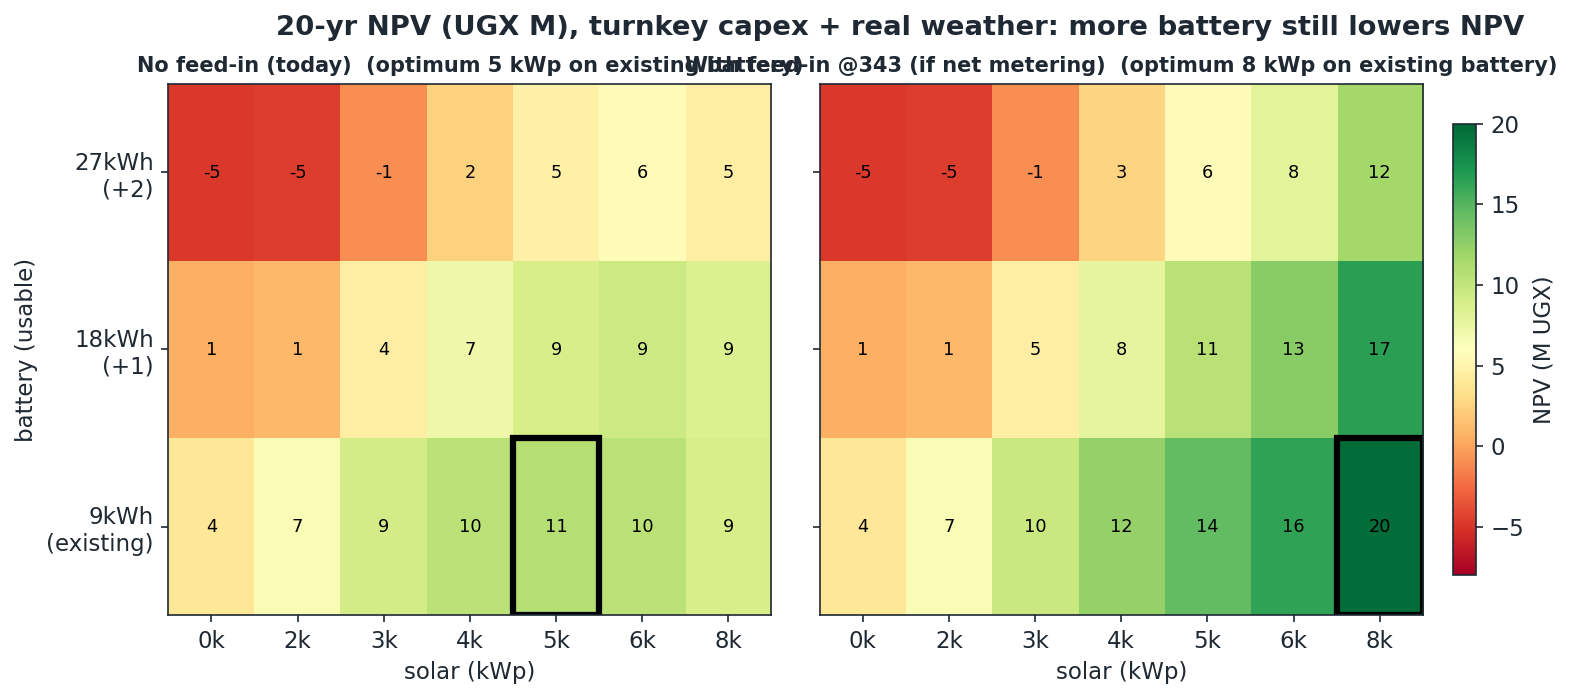
The greenest cells sit on the bottom row, the battery NFE already owns. Moving up (more battery) turns the map redder at every solar size. Moving right (more solar) raises NPV until spill, or keeps rising with feed-in.
Investment metrics (15 percent cost of capital)
| Allocation | Upfront | Payback | ROI (20-yr cumulative) | IRR | NPV at 15% | NPV at 22% |
|---|---|---|---|---|---|---|
| 5 kWp (no feed-in, today) | 6.3M | 2.2 yr | 723 percent | 45 percent | 10.8M | 6.0M |
| 8 kWp (if net metering arrives) | 10.1M | 2.1 yr | 811 percent | 48 percent | 19.6M | 11.3M |
Findings
- Do not buy more battery for return. At every solar size, adding a battery unit lowers 20-year NPV; two extra units go negative. The battery capex is not recovered within the horizon.
- Why: battery is expensive per kWh (5.57M for 8.9 kWh is about 626,000 per kWh) versus solar; the conservative aging assumption erodes its contribution; and the discount rate weights the faded later years lightly.
- Solar income is resilient to battery aging. Battery-only savings halve over 20 years; the solar cases decline far less, because daytime solar self-consumption does not depend on the battery.
- Feed-in changes the size, not the shape. If net metering arrives, the optimum shifts to more solar (about 8 kWp) because surplus is sold rather than spilled, but the answer is still to spend on panels, not battery.
The one important caveat for the bank case
This prices energy savings only. It does not price the battery's real job, backup and reliability during outages. So for a lender: solar (and the existing battery) is the return story, financed on the payback and NPV above; additional battery, if wanted, is a resilience decision justified separately, not folded into the ROI case.
Recommendation
Fund about 5 kWp of solar on the existing battery now (about 6.3M turnkey, payback about 2.2 years, IRR about 45 percent). If net metering arrives, scaling to about 8 kWp becomes the better allocation. Treat any extra battery as reliability capex with its own justification.
For how cheap battery must get before expanding it pays, see Battery Price Break-Even. Companion cases: Battery Arbitrage (alone) and Solar Plus Battery.