
Optimal Solar and Battery Allocation (Sezibwa)
showData provenance
[!info]UnderlyingConservative,data:bank-facingthebasis.aggregateTariff:meterUEDCLmeter_100Codeplus10.2the 10 customer sub-meters, overQ32026-03-192026to 2026-08-10, from the modbus energy-logger archive (Peaksources:666.5pi-direct/andShouldernextcloud-import),562.1i.e./theOff-Peakpre-429.7andUGX/kWh).early-OpenEMSTheperiod.scheduleLoad basis is aconfigurableconservativemodel21.3inputkWh/day.forNote
mid-Augustfuture(2026-08-20):ERA/UEDCLtherevisions.siteTurnkeyhascapex,sincerealmigratedweather.toReproducibleOpenEMS, which is now the live source. OpenEMS-sourced daily figures fromnfe_solar_model.py.
Headline
Sweeping both dimensionsinconsistencies (solarthe sizeaggregate roughly doubled exactly at the source switchover, and batteryon capacity)some days the customer-meter sum exceeds the aggregate), so they are treated as a data-quality issue to findresolve thebefore bestuse; 20-yearthis returnanalysis gives a clear, slightly counterintuitive answer:
The most business-optimal allocation is solar-heavy and battery-light. Put the money into panelsstays on the batteryvalidated alreadyarchive. owned.Phase Addingassignments battery capacity lowersreflect the return at today's battery price.
Sezibwa zero-export-value base case: about5 kWpon the existing 8.9 kWh battery. Turnkey capex about6.3M UGX,IRR about 42 percent, simple payback about2.3 years, discounted payback about3.1 years, 20-year NPV about9.8M at 15 percent.With a usable export arrangement: about8 kWpon the same battery. Capex about10.1M, IRR about46 percent, NPV about18.5M. (This scenario assumes surplus is credited at343 UGX/kWh— a deliberately conservative, below-retail rate consistent with how net-metering credits typically pay; the real credit value under ERA's 2024 regulations is unconfirmed for this site.)In both, buying a second or third battery unitlowersNPV.
Method
A 2-D sweep over solar (0 to 8 kWp) and battery (existing one unit, or plus one or two SR-SE10B units). For each combination the model runs the real load through 20 years and computes discounted savings minus turnkey capex.
Result
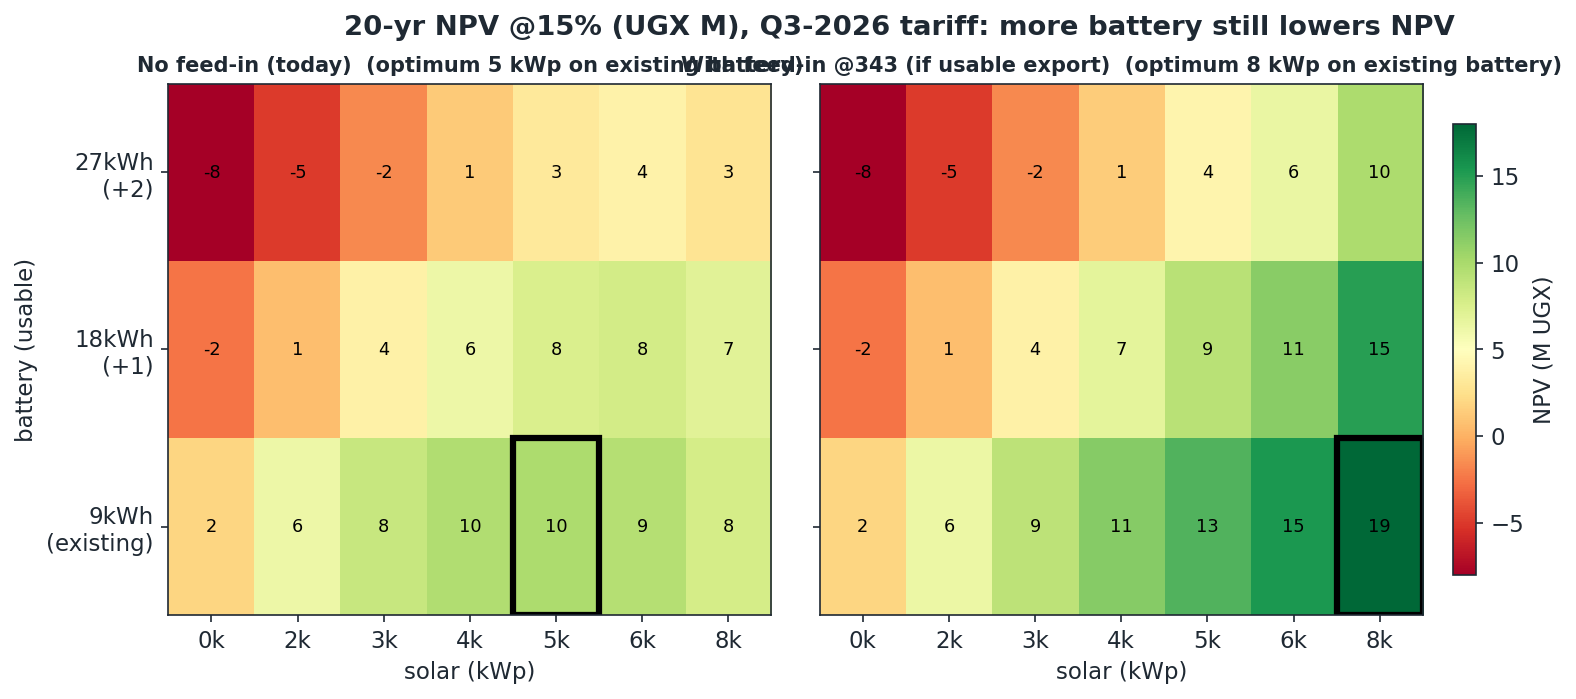
The greenest cells sit on the bottom row, the battery NFE already owns. Moving up (more battery) turns the map redder at every solar size.
[!note] 4 kWp versus 5 kWp4 kWp is the low-spill efficiency sweet spot:it captures most of the available bill reduction with almost no curtailed solar.5 kWp is the maximum-NPV optimum:the fifth kWp introduces some spill, but its remaining useful generation is still worth slightly more than its marginal installed cost. The two sizes optimize different objectives.
Investment metrics and sensitivity
NPV shown across discount rates so you can see which allocation survives expensive capital (metrics ranked NPV, IRR, discounted payback, simple payback, then cumulative ROI):
Both survive a 25 percent cost of capital comfortably. (The undiscounted 20-year cumulative ROI is large, ~680 to 780 percent, but it is not a decision metric; NPV and IRR carry the case.)
Findings
Do not buy more battery for return.At the 5 kWp anchor, adding even the first battery unit lowers 20-year NPV by about 2.3M UGX; a second and third are progressively more negative (about −6.6M and −11.5M). The battery capex is not recovered within the horizon at today's ~626,000 UGX/kWh.Solar income is resilient to battery aging;battery-only savings halve over 20 years, the solar cases decline far less.Value, not penetration.Beyond ~4 to 5 kWp, extra panels spill and returns diminish unless storage gets cheaper or export becomes usable.
Battery replacement strategy
The model conservatively assumes the battery simply fades to 50 percent over 20 years. A real long-horizon plan should choose one of three strategies, and the economics differ:
Operate the original battery for all 20 years(what the model assumes — the pessimistic bound; usable capacity, and so the evening-shift slice, keeps shrinking).Replace oncewhen usable capacity hits a chosen threshold (say ~70 percent around year 10 to 12): restores capacity at the cost of a fresh battery, worth it only if battery prices have fallen (see the break-even case).Augment graduallyby adding cellswiring asloadobservedgrows rather than replacing.
Importantly, the recommended allocation (solar-heavy, existing battery) is the least exposed to this: solar self-consumption does not depend on the battery, so battery replacement is a reliability/backup decision, not a driver of the solar return.
The caveat for the bank case
This prices energy savings only. It does not price the battery's real job, backup and reliability during outages. Solar is the return story; additional battery is a resilience decision justified separately.
Recommendation
Fund about 5 kWp of solar on the existing battery to maximize NPV (about 6.3M turnkey, IRR about 42 percent); choose 4 kWp instead where the priority is the low-spill efficiency sweet spot. If a usable export arrangement materialises, scalingup to about 8May kWp2026 becomesand better.should Forbe howre-verified cheapagainst batterythe mustcurrent getOpenEMS beforesetup expandingif itany pays,connections seehave Batterybeen Pricechanged.