
Solar Plus Battery Economic Case (Sezibwa)
Headline
Adding a small solar array to the existing Sezibwa inverter and battery pays back in under two years on metering-validated load. The existing SRNE ASP48120SH3 (12 kW, dual MPPT, 18 kWp of PV headroom) and the SR-SE10B 8.9 kWh battery are already bought (9.4M UGX sunk), so this is only the cost of the panels plus balance-of-system, not a whole new system.
Key numbers (4 kWp case):
- Bill offset: about 62 percent
- Monthly saving: about 237,000 UGX
- Installed cost: about 4.16M UGX at cost, about 5.02M UGX as a turnkey quote
- Payback: about 1.5 to 1.8 years
Load basis (validated)
The whole analysis rides on one number: how much power the site actually uses. The site aggregate meter (meter_100) reads about 21 kWh per day. An earlier utility bill suggested about 12 kWh per day, which would have roughly doubled the payback, so the discrepancy was resolved before trusting the case.
Three independent lines of evidence confirm about 21 kWh per day:
- Cross-meter check: meter_100 (21.2 kWh per day) versus the independent sum of all ten customer submeters (20.4 kWh per day) gives a ratio of 1.04. A 4 percent gap is ordinary line loss and common load, so meter_100 is accurate and not double counting.
- No ramp: meter_100 read 21.2 kWh per day from its very first logged stretch (19 to 31 March) and held steady through May.
- The 12 kWh per day figure came from a 36 day billing period that ended before meter_100 started logging on 19 March. It covers an earlier, lower-occupancy commissioning window, not the same load.
Energy conservation seals it: with no on-site generation and a battery that only time-shifts energy, grid import must equal consumption, so the site now draws about 21 kWh per day (about 630 kWh per month).
The load shape and why timing matters
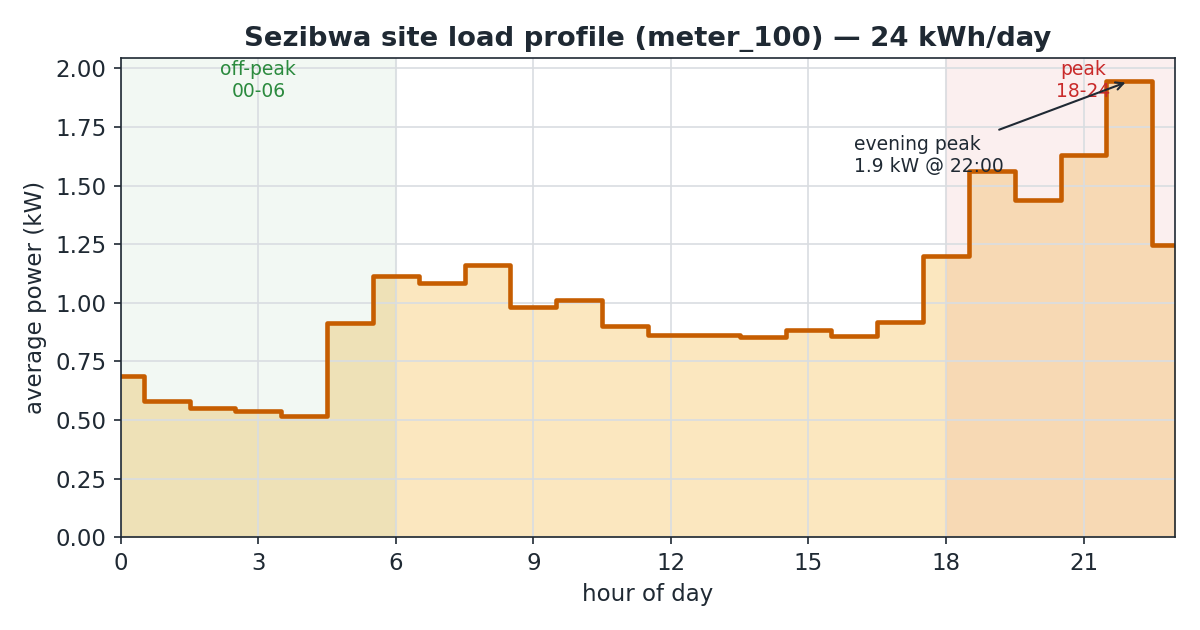
The load trough is overnight (cheap off-peak hours) and the load peak is the evening, sitting inside the expensive peak tariff window (18:00 to 24:00 at 753 UGX per kWh). Solar, by contrast, generates midday. The two peaks miss each other by about six hours, and that mismatch is the central constraint on how much solar is useful.
Sizing and the spill mechanism
The 4 kWp figure was found by sweeping 3, 4, 5 and 6 kWp and locating the point where wasted solar starts to climb steeply. Sizing straight from the load, 21 kWh per day divided by about 3.75 kWh per day per kWp is about 5.5 kWp to generate energy equal to daily consumption. But the useful size is capped lower by timing, a fixed battery, and no feed-in.
How the spill (curtailment) happens: midday surplus solar has exactly three possible destinations. It can serve the small daytime load, it can charge the battery until it is full at 8.9 kWh, or it can export to the grid, which is not possible because this site has no net-metering available today. Uganda currently has no net-metering in effect for residential or commercial connections; a non-residential net-metering policy is anticipated but not yet enacted. Once the daytime load is served and the battery is full (late morning on a strong day), any further solar has nowhere to go, so the inverter throttles the panels and that energy is never harvested. That un-harvested energy is the spill.
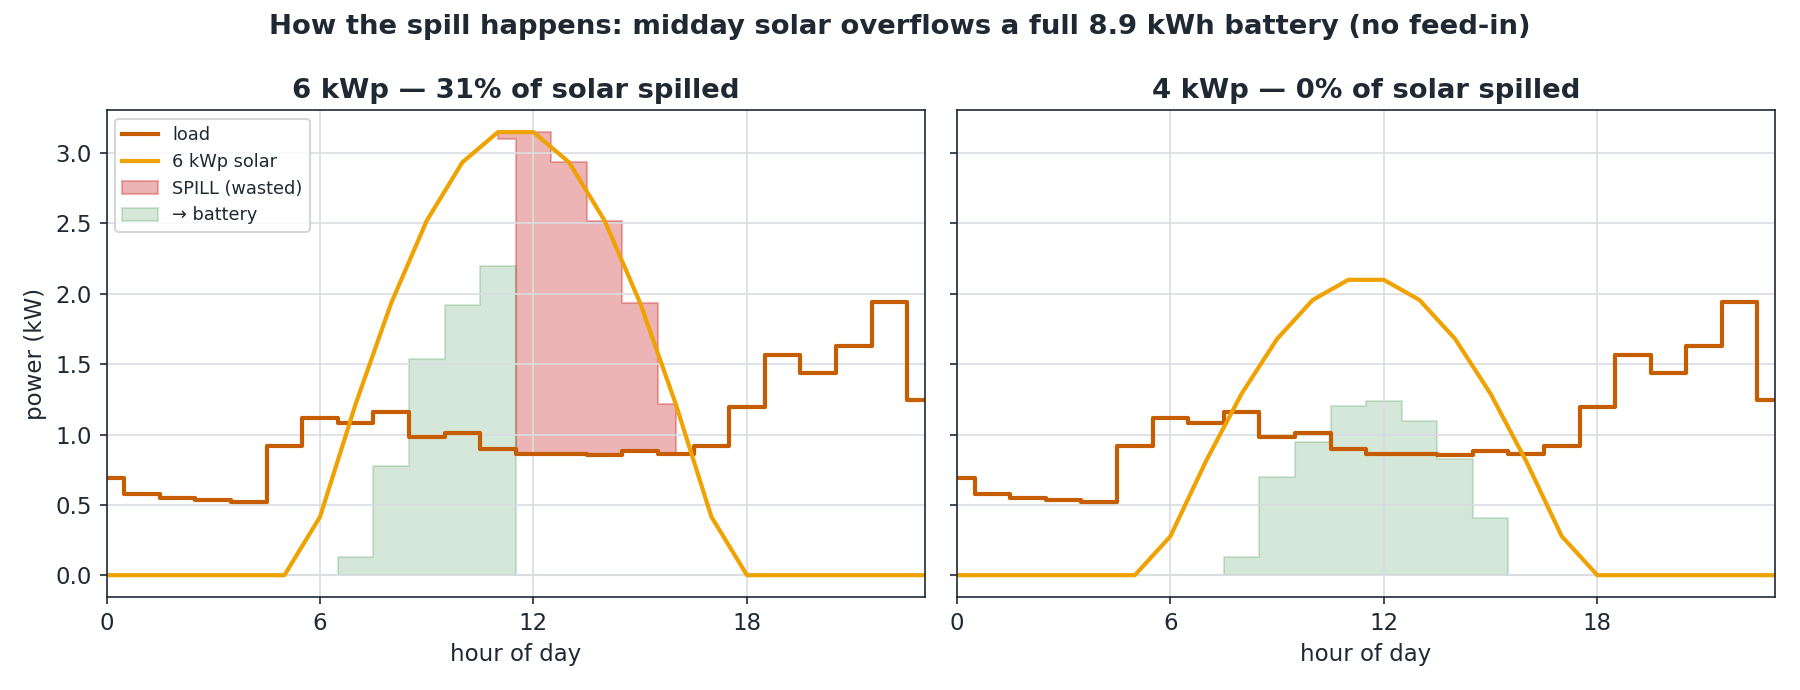
A bigger array fills the fixed 8.9 kWh battery faster and then piles onto the wasted heap, so spill rises steeply with size:
| Array | Bill offset | Solar spilled |
|---|---|---|
| 3 kWp | 48 percent | 0 percent |
| 4 kWp | 62 percent | 6 percent |
| 5 kWp | 67 percent | 20 percent |
| 6 kWp | 69 percent | 39 percent |
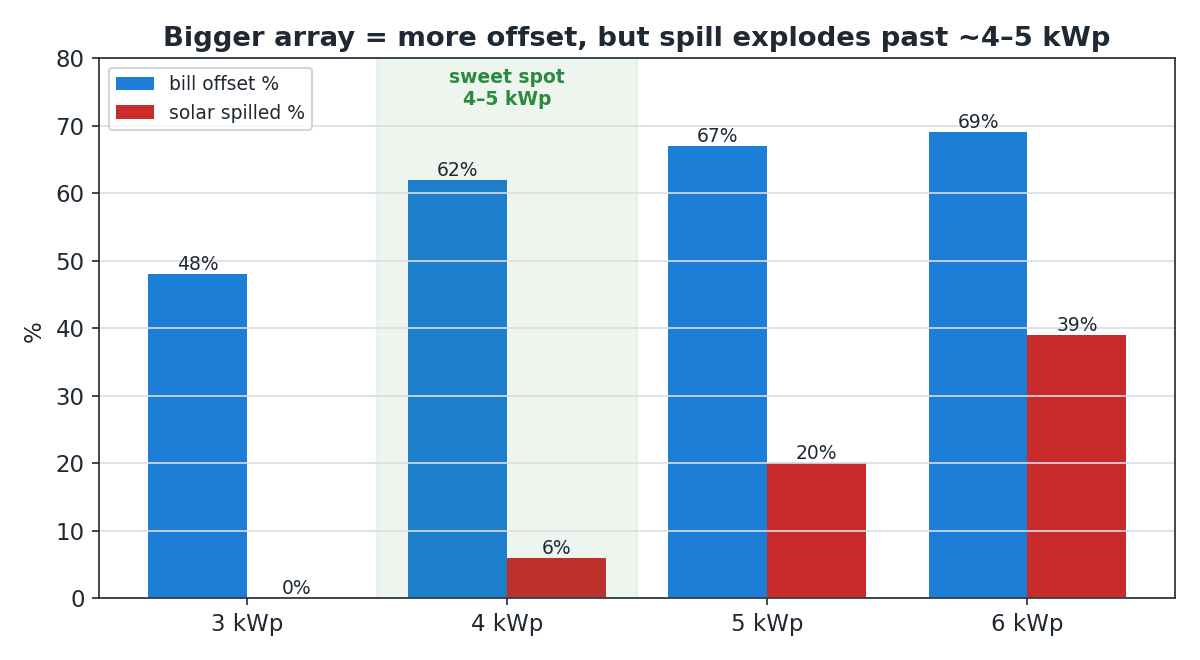
4 kWp is the largest array whose midday surplus still fits the daytime load plus the existing battery, with almost no waste. 5 kWp buys a little more offset at about 20 percent waste. Going larger only pays off with more battery (to store the surplus for the evening) or feed-in (to sell it).
Capex from the real catalog
Priced from the Rincol ERP catalog (7 panels of 600 Wp, railing, 6 mm UV cable, PV combiner, DC breaker, earthing, surge arrester, labour and design):
| Basis | 4 kWp installed cost |
|---|---|
| At cost | about 4.16M UGX |
| Turnkey quote | about 5.02M UGX |
Two catalog gaps to close before quoting: there is no DC-rated PV surge arrester (only an AC one), and no standalone MC4 connector line. A 315 V string in a lightning-prone area needs the DC surge arrester.
Payback
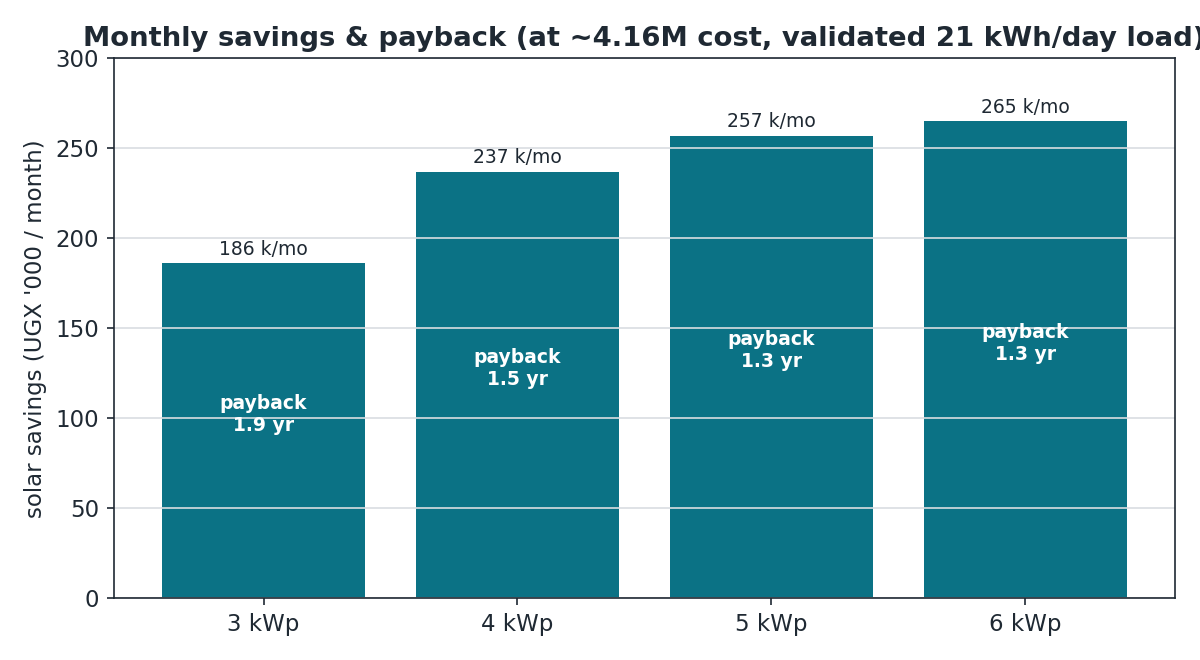
Payback is capex divided by monthly solar saving:
| At cost (4.16M) | Turnkey (5.02M) | |
|---|---|---|
| 4 kWp (237k per month) | about 1.5 years | about 1.8 years |
Correction to the earlier financing model
The earlier financing model was optimistic in one direction and pessimistic in another, and the two nearly cancel:
- It overstated bill offset (71 to 96 percent) because it balanced monthly energy without accounting for the midday-to-evening timing mismatch and the absence of feed-in. The realistic offset is 48 to 69 percent.
- It overstated capex far more (10 to 13M assumed for about 3 kWp) versus the real marginal cost of about 4 to 5M for 4.2 kWp from the actual catalog.
Net effect: payback improves to 1.5 to 3 years rather than worsening. The reason capex is low is that the inverter and battery are already sunk, so solar is only the panel add.
Open items
- A recent utility bill for the site meter would be paper confirmation of the 21 kWh per day load (confirmatory, not decision-changing).
- OpenEMS-native validation would confirm the real controller delivers close to these scoping numbers (fidelity check, not decision-changing).
Battery aging over 20 years
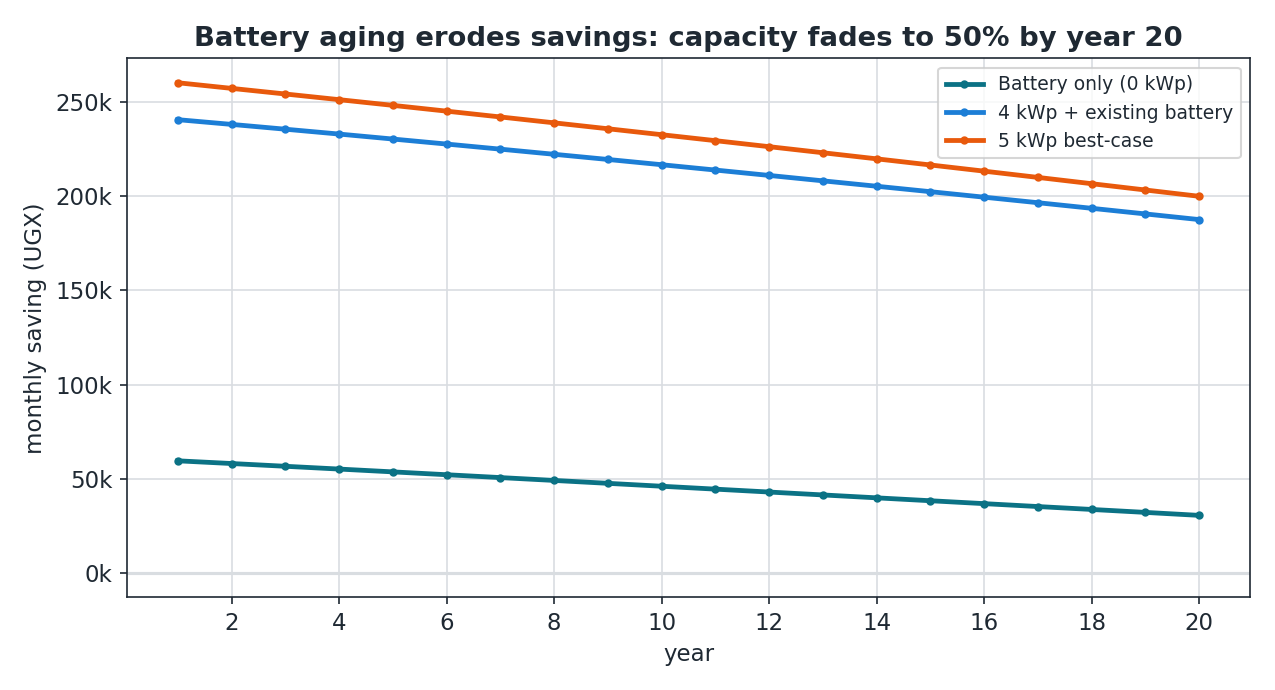
Taking the conservative assumption that the battery's usable capacity fades to 50 percent by year 20, the 4 kWp saving falls from about 240,000 UGX per month today to about 188,000 by year 20. That is a decline of only about a fifth, far gentler than a battery-only system, which halves. The reason is that daytime solar self-consumption does not depend on the battery at all; only the evening-shift slice fades. Solar makes the income resilient to aging.
Over 20 years the undiscounted total is about 51.6M UGX and the NPV at a 15 percent discount rate is about 13.0M. Payback stays about 1.4 years, because the savings are largest in the early years before the battery has faded.
For the joint optimization that sweeps both solar and battery size with this aging model, see Optimal Solar and Battery Allocation.
Related
Battery Arbitrage Economic Case (Sezibwa) covers the same battery operated for time-of-use arbitrage without solar (about 42,000 to 77,000 UGX per month), for comparison with the solar case above.
Important: the solar case already captures the arbitrage that is compatible with the battery. It discharges the battery through the evening peak (peak avoidance), sourced from solar. Layering grid arbitrage (off-peak grid charging) on top is counterproductive when solar is sufficient: it fills the battery with paid off-peak energy and forces the next day's free solar to spill (tested: about minus 23,000 UGX per month at 4 kWp). There is only one battery cycle per day, so solar and pure grid arbitrage compete for it and are NOT additive. Do not add the two pages' savings together. Grid arbitrage only adds value on low-solar days, which needs a variable-weather time series to quantify.