
Solar Plus Battery Economic Case (Sezibwa)
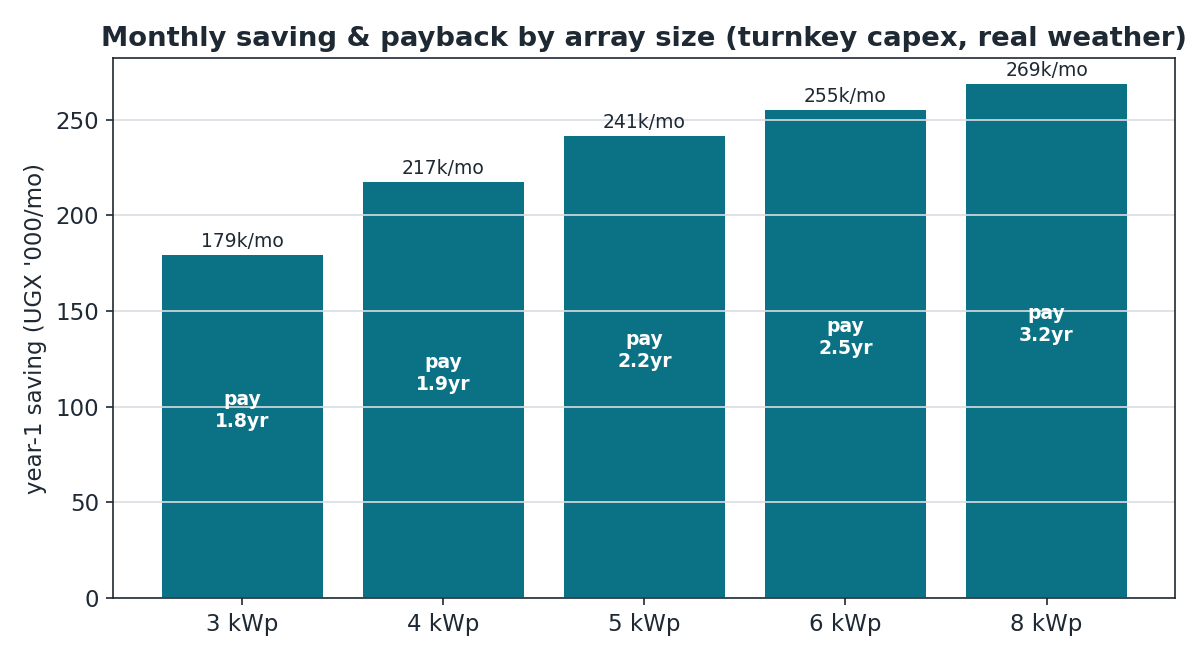
[!info] Conservative, bank-facing basis (revised after independent review) All figures use turnkey installed capex (the price a lender finances, not the at-cost floor) and real day-to-day weather (a seeded variable-irradiance year, not a clear sky every day). Both pull the numbers down from an earlier optimistic draft. They are the numbers to take to a lender.
Headline
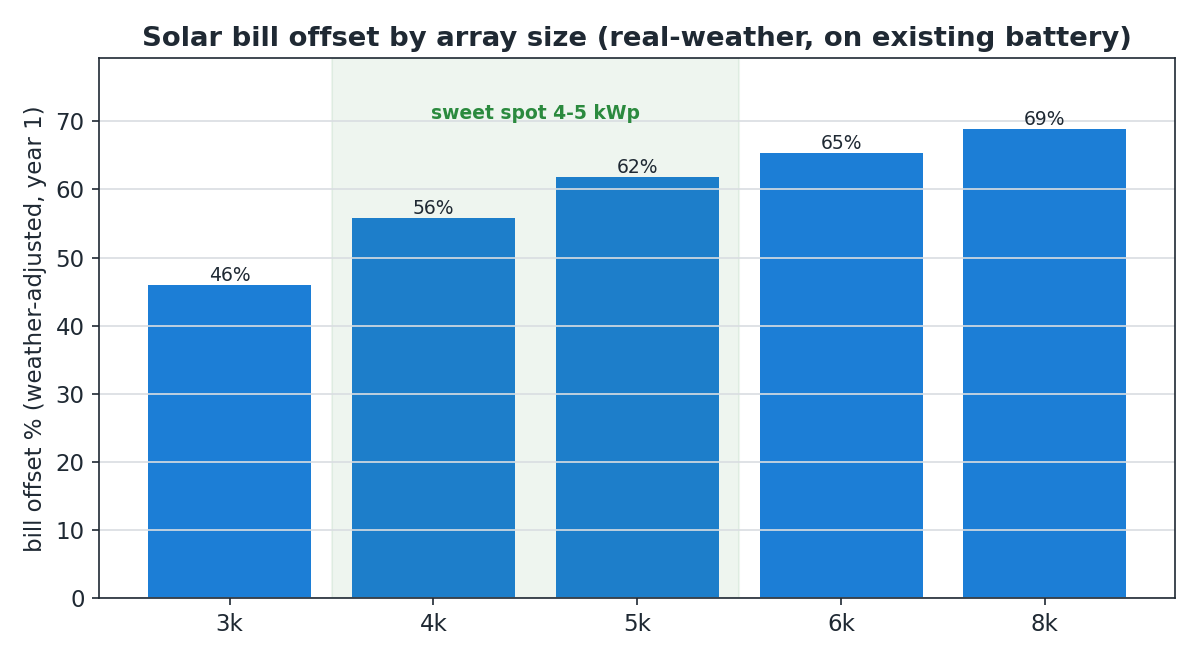
Adding a4 smallkWp of solar array(7 x 600 Wp) to the existing SezibwaSRNE inverter and battery pays back in under two years on metering-validated load. The existing SRNE ASP48120SH3 (12 kW, dual MPPT, 18 kWp of PV headroom) and the SR-SE10B 8.9 kWh battery offsets about 56 percent of the site's electricity bill on the real load and real weather. The inverter and battery are already bought (9.4M UGX sunk), so this is only the cost of the panels plus balance-of-system, not a whole new system.
Key numbers (4 kWp case):panels.
BillYear-1offset:saving about62217,000 UGX per month (about 56 percent of a ~390,000 UGX/month bill).MonthlyTurnkeysaving:installed cost about237,0005.0M UGX.Installed cost:Payback about4.16M1.9 years; IRR about 51 percent; 20-year NPV about 10.4M UGX atcost,15about 5.02M UGX as a turnkey quotePayback: about 1.5 to 1.8 yearspercent.
Load basis (validated)
The whole analysis rides on one number: how much power the site actuallyload, uses.so it is worth stating the confidence honestly. The site aggregate meter (meter_100) reads about 21 kWh per day. This is validated internally: it matches the independent sum of the 10 customer submeters to within 4 percent (ratio 1.04), and the meter read that level from its first logged day. An earlier utility bill suggestedimplied about ~12 kWh per kWh/day, whichbut wouldit have roughly doubled the payback, so the discrepancy was resolved before trusting the case.
Three independent lines of evidence confirm about 21 kWh per day:
Cross-meter check: meter_100 (21.2 kWh per day) versus the independent sum of all ten customer submeters (20.4 kWh per day) givescovered aratio of 1.04. A 4 percent gap is ordinary line loss and common load, so meter_100 is accurate and not double counting.No ramp: meter_100 read 21.2 kWh per36-dayfrom its very first logged stretch (19 to 31 March) and held steady through May.The 12 kWh per day figure came from a 36 day billingperiod that ended beforemeter_100thestartedmeterloggingbeganonlogging,19duringMarch. It covers an earlier, lower-occupancyearlier commissioningwindow,with fewer active customers.[!gap] Independent confirmation still outstanding The internal cross-check is strong, but the one fully independent confirmation, a recent UEDCL bill for meter U214624, has not
theyetsamebeenload.obtained.
Energynumber conservationscales sealsevery it:saving with no on-site generation and a battery that only time-shifts energy, grid import must equal consumption,below, so the sitebill nowshould drawsbe aboutpulled 21before kWhthe perloan daymeeting. If current load is lower (aboutsay 63015 kWhto per17 month).kWh/day), paybacks lengthen roughly 30 to 40 percent.
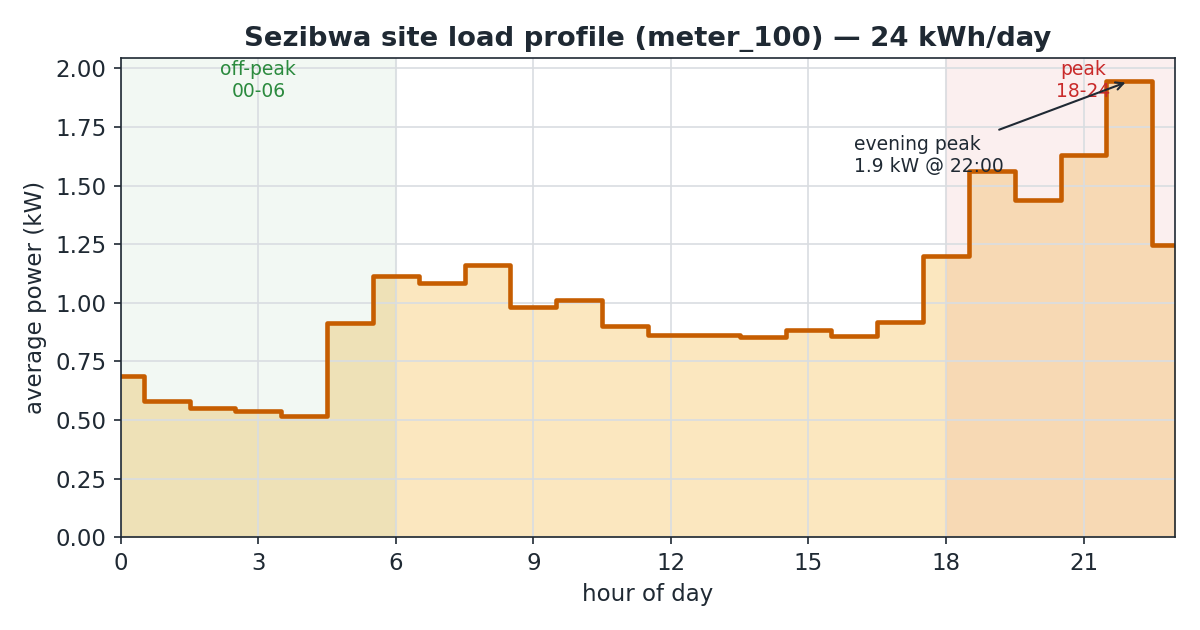
TheWhy load shapesolar and whynot timingjust mattersthe battery
The load trough is overnight (cheap off-peak hours)peak) and the load peak is the evening, sitting inside the expensive peak tariff window (18:00 to 24:00 at 753 UGX per UGX/kWh). Solar, by contrast,Solar generates midday.midday, Theso the two peaks miss each other by about six hours,hours. andThe thatbattery mismatchbridges the gap, but only the evening slice; the bigger win is solar serving the centraldaytime constraintload ondirectly. how much solarThat is useful.
Sizing and the spill mechanism
The 4 kWp figure was found by sweeping 3, 4, 5 and 6 kWp and locating the point where wasted solar starts to climb steeply. Sizing straight from the load, 21 kWh per day divided by about 3.75 kWh per day per kWp is about 5.5 kWp to generate energy equal to daily consumption. But the useful size is capped lower by timing, a fixed battery, and no feed-in.
How the spill happens (curtailment)why happens:4 middaykWp, not more)
Midday surplus solar has exactly three possible destinations. It canhomes: serve the small daytime load, it can charge the battery until it is full at 8.9 kWh, or it can export to the grid, which is not possible because Uganda has no net metering today (a net-metering policy is anticipated but not yet enacted). Once the daytime load is served and the battery is fullfull, (late morning on a strong day), any furtherextra solar hasis nowherecurtailed to go, so (the inverterspill). throttles the panels and that energy is never harvested. That un-harvested energy is the spill.
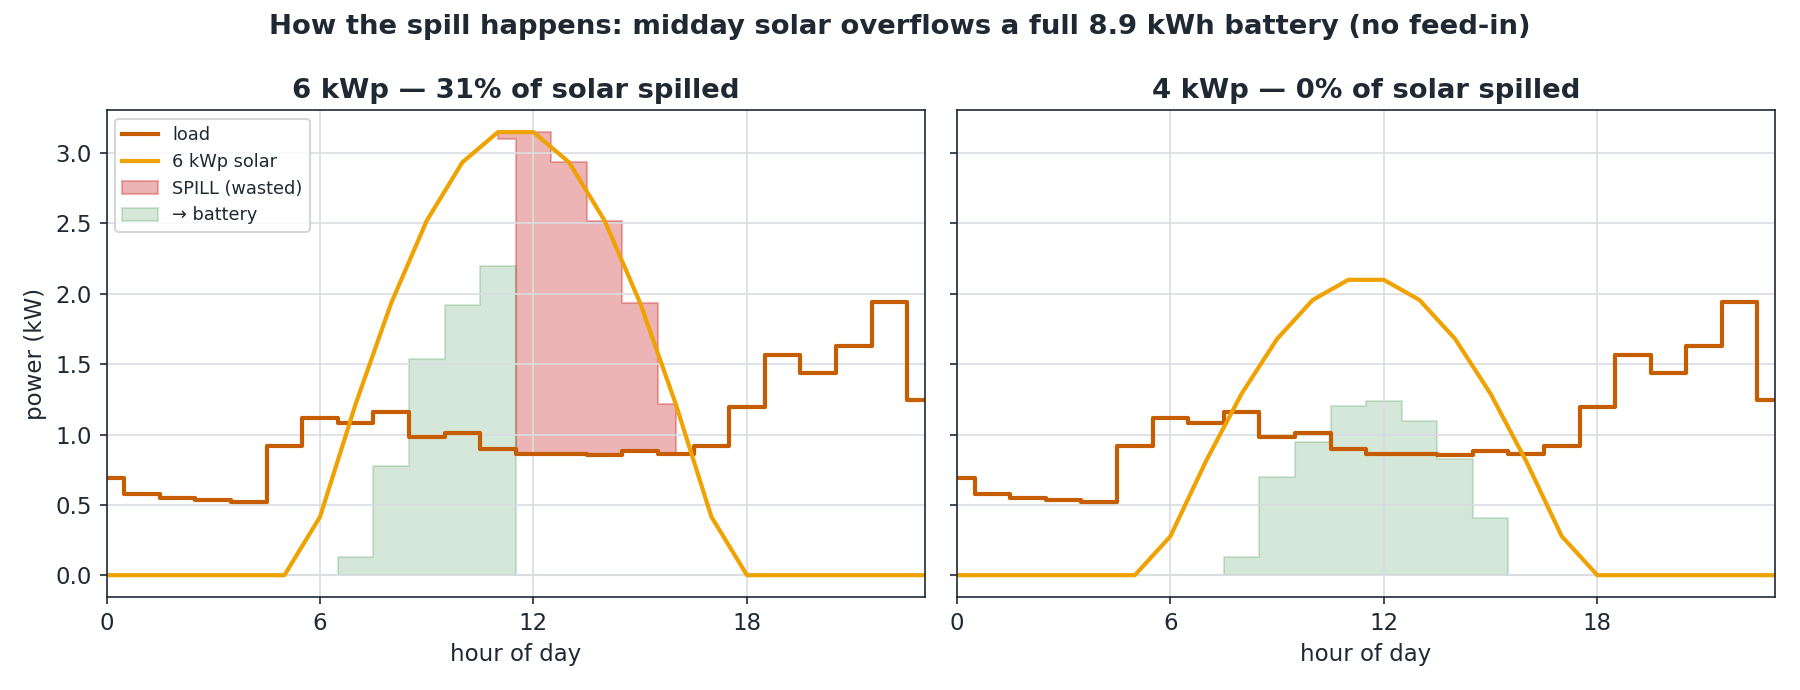
A bigger array fills the fixed 8.9 kWh battery faster and thenspills piles onto the wasted heap,more, so spill rises steeply with size:
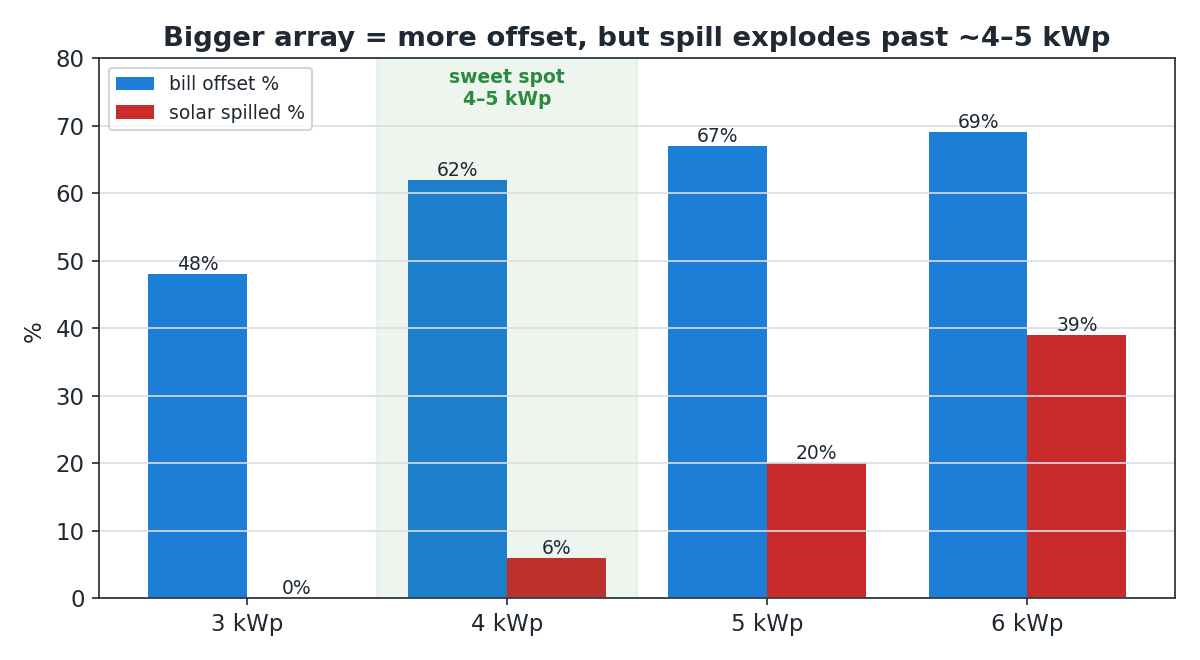
4 kWp is the largest array whose midday surplus still fitsnear the daytimepoint loadwhere plusalmost nothing is wasted.
(The spill diagram is a clear-day illustration of the existing battery, with almost no waste. 5 kWp buys a little more offset at about 20 percent waste. Going larger only pays off with more battery (to storemechanism; the surplusheadline forsavings above already apply the evening)real-weather orhaircut feed-inacross (tothe sellyear.)
Capex from the real catalog
Priced (from the Rincol ERP catalog (7 panels of 600 Wp, railing, 6 mm UV cable, PV combiner, DC breaker, earthing, surge arrester, labour and design):
| Basis | 4 kWp installed cost |
|---|---|
| about |
|
| about |
The headline uses the turnkey number. Two BOM items the catalog gapswas tomissing close before quoting: there is no(a DC-rated PV surge arrester (only an AC one), and no standalone MC4 connector line. A 315 V string in a lightning-prone area needs the DC surge arrester.
Payback
Payback is capex divided by monthly solar saving:
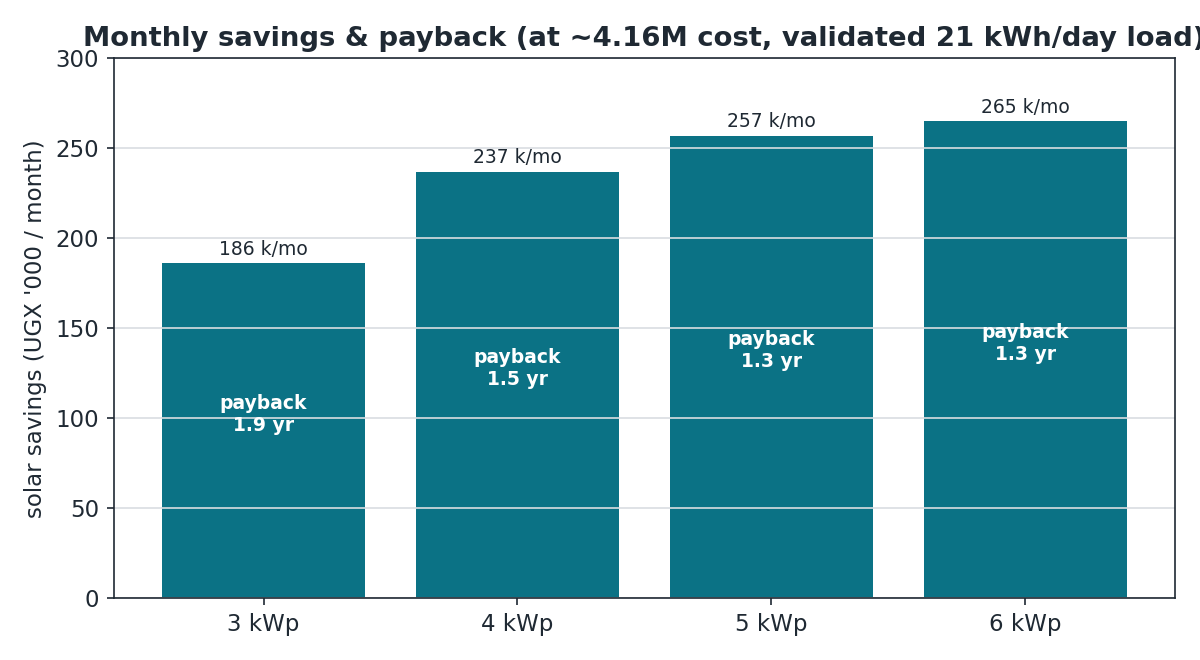
Correction to the earlier financing model
The earlier financing model was optimistic in one direction and pessimistic in another, and the two nearly cancel:
It overstated bill offset (71 to 96 percent) because it balanced monthly energy without accounting for the midday-to-evening timing mismatch and the absence of feed-in. The realistic offset is 48 to 69 percent.It overstated capex far more (10 to 13M assumed for about 3 kWp) versus the real marginal cost of about 4 to 5M for 4.2 kWp from the actual catalog.
Net effect: payback improves to 1.5 to 3 years rather than worsening. The reason capex is low is that the inverter and batteryconnectors) are alreadynow sunk, so solar is only the panel add.included.
Open items
A recent utility bill for the site meter would be paper confirmation of the 21 kWh per day load (confirmatory, not decision-changing).OpenEMS-native validation would confirm the real controller delivers close to these scoping numbers (fidelity check, not decision-changing).
Investment metrics (15 percent cost of capital)
| Metric | Value |
|---|---|
| Upfront cost (turnkey) | about |
| Payback | about 1. |
| IRR | about |
| ROI (20- |
about |
| NPV at 15 percent | about 10.4M UGX |
| NPV at 22 percent (commercial loan) | about 6.1M UGX |
Year-1 saving about 240,217,000 UGX per UGX/month; 20-year total saved about 51.6M47.2M UGX (raw profit about 47.6M before discounting).
Metrics at a 15 percent cost of capital (the assumed financing rate).UGX. Payback is the time to recover the upfront cost; ROI is the total lifetime return on that cost; IRR is the project's effective annual return, and a lender funds a project when its IRR comfortably exceeds the loan rate;rate (here 51 percent versus an 18 to 26 percent loan, a clear yes); NPV is the wealth created expressed in today's money. SolarThe project stays strongly positive acrosseven anyat realistica rate22 (10 to 24 percent) because the payback is so short; thepercent discount raterate.
Battery aging over 20 years
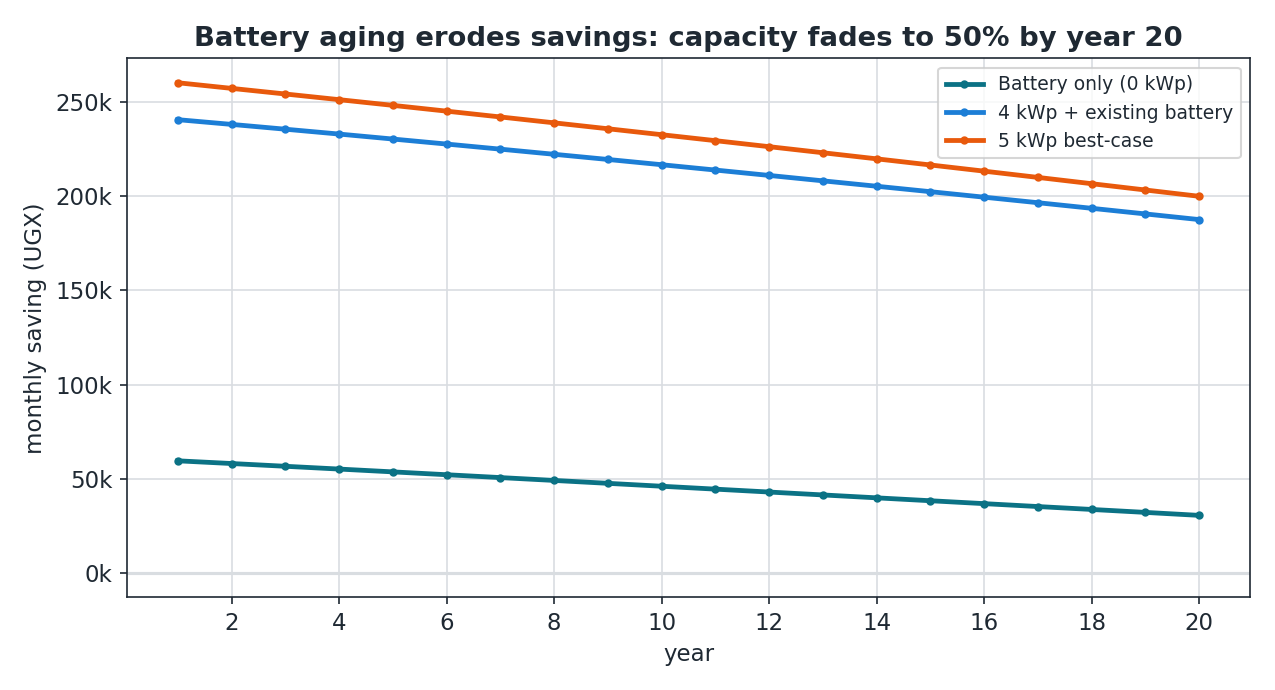
Taking the conservative assumption thatWith the battery's usable capacity fadesfading to 50 percent by year 20,20 (a conservative assumption), the 4 kWp saving falls from about 240,000 UGX per month today to about 188,000 by year 20. That is a decline ofdeclines only about a fifth,gently, far gentlerless than a battery-only system,system which halves.halves, The reason is thatbecause daytime solar self-consumption does not depend on the battery at all; only the evening-shift slice fades.battery. Solar makes the income resilient to aging.
Over 20 years the undiscounted total is about 51.6M UGX and the NPV at a 15 percent discount rate is about 13.0M. Payback stays about 1.4 years, because the savings are largest in the early years before the battery has faded.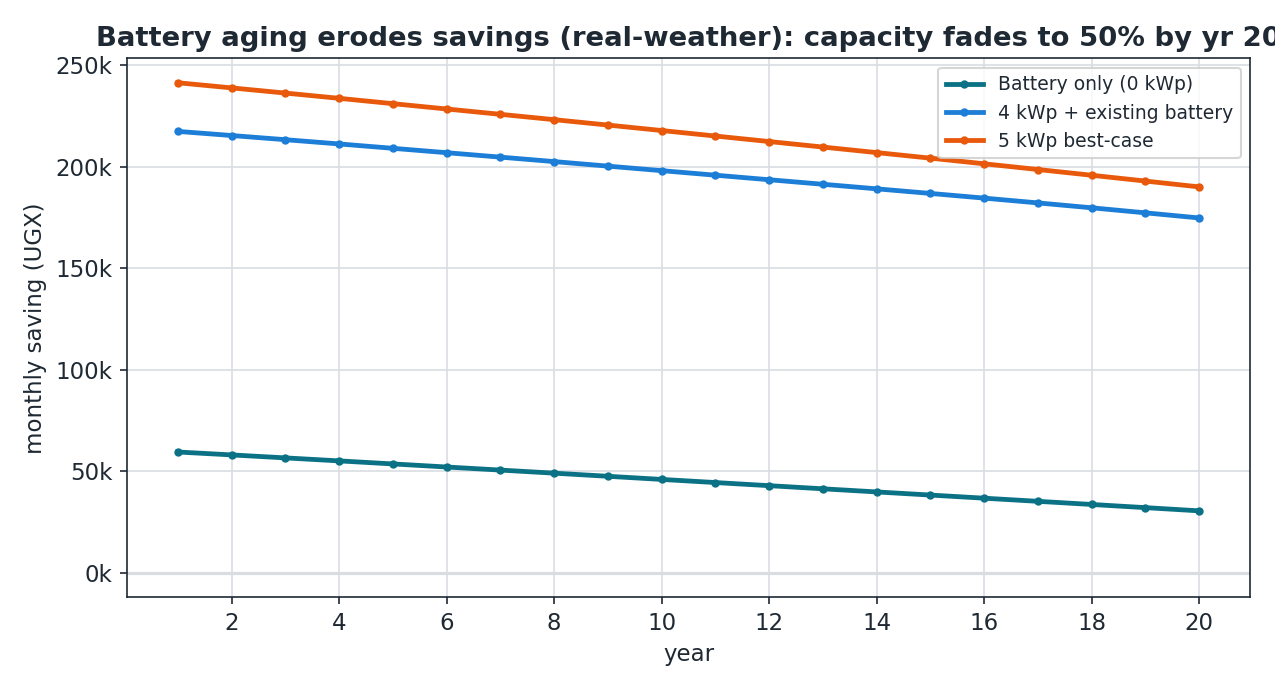
Related
ForCompanion thecases: jointBattery optimizationArbitrage that sweeps both solar and battery size with this aging model, see(alone), Optimal Solar and Battery Allocation.
Related
and Battery ArbitragePrice EconomicBreak-Even. CaseAll (Sezibwa)four coversshare the same batteryconservative operated for time-of-use arbitrage without solarbasis (aboutturnkey 42,000capex, toreal 77,000 UGX per month), for comparison with the solar case above.
Important: the solar case already captures the arbitrage that is compatible with the battery. It discharges theweather, batterythrough the evening peak (peak avoidance), sourced from solar. Layering grid arbitrage (off-peak grid charging) on top is counterproductive when solar is sufficient: it fills the battery with paid off-peak energy and forces the next day's free solar to spill (tested: about minus 23,000 UGX per month at 4 kWp)aging).There is only one battery cycle per day, so solar and pure grid arbitrage compete for it and are NOT additive. Do not add the two pages' savings together. Grid arbitrage only adds value on low-solar days, which needs a variable-weather time series to quantify.