
Solar Plus Battery Economic Case (Sezibwa)
[!info] Conservative, bank-facing basis (revised after independent review) All figures use turnkey installed capex (the price a lender finances, not the at-cost floor) and real day-to-day weather (a seeded variable-irradiance year, not a clear sky every day). Both pull the numbers down from an earlier optimistic draft. They are the numbers to take to a lender.
Headline
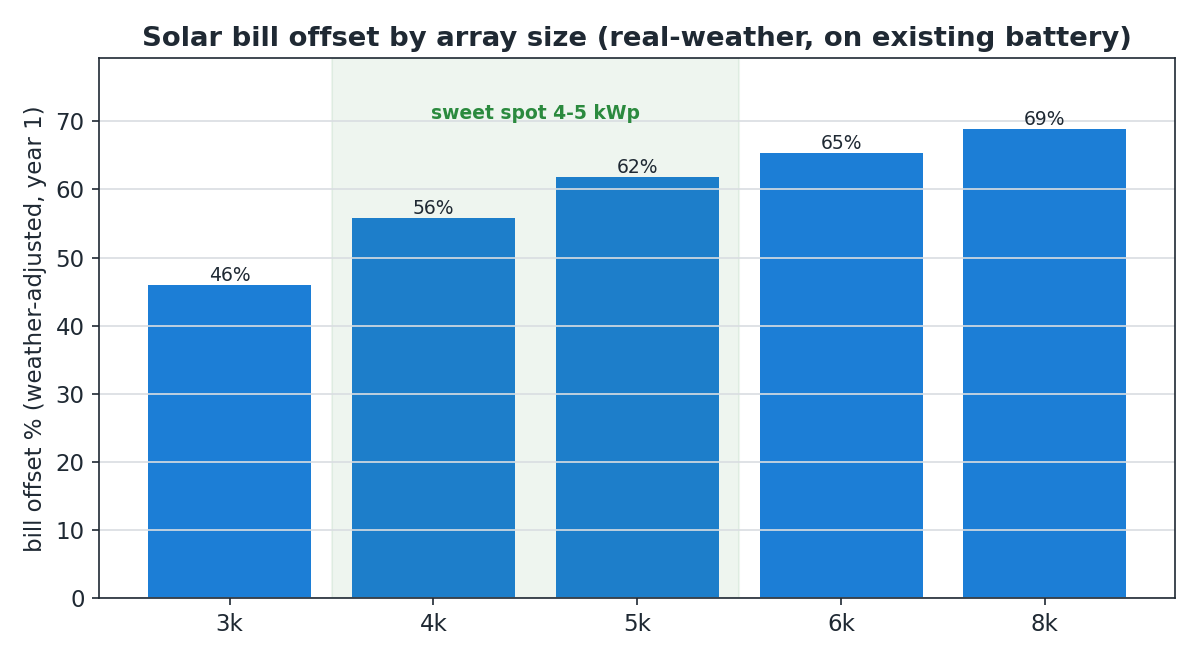
Adding 4 kWp of solar (7 x 600 Wp) to the existing SRNE inverter and 8.9 kWh battery offsets about 56 percent of the site's electricity bill on the real load and real weather. The inverter and battery are already bought (9.4M UGX sunk), so this is only the cost of the panels.
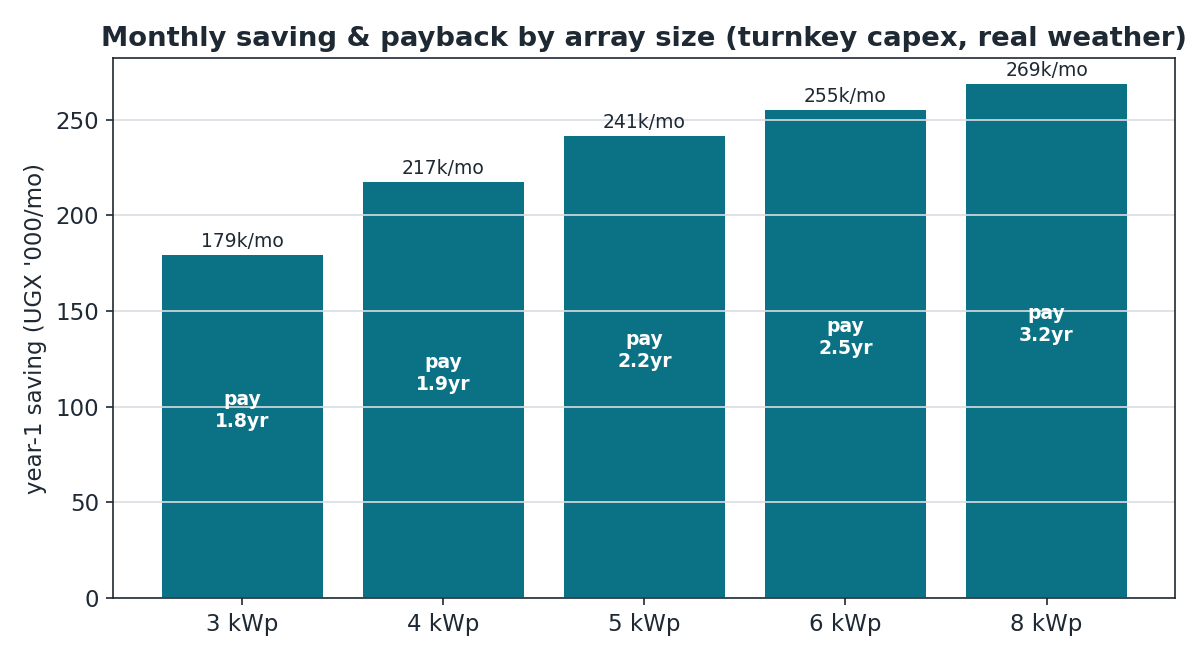
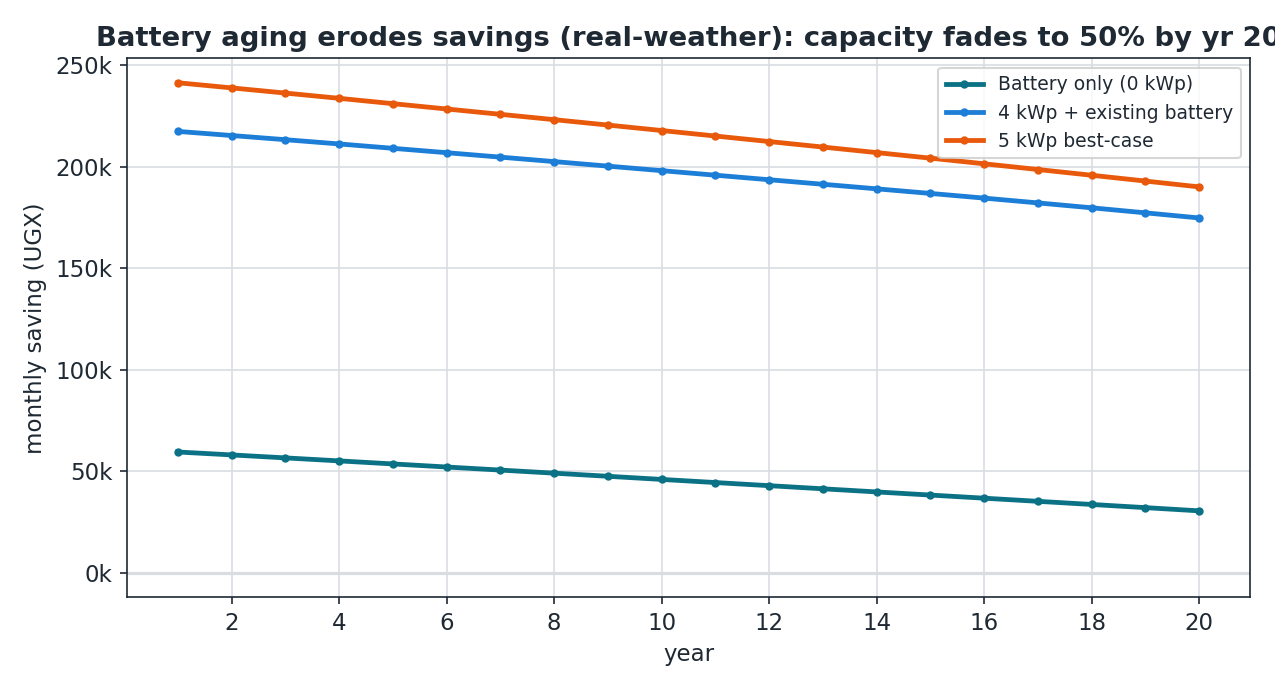
- Year-1 saving about 217,000 UGX per month (about 56 percent of a ~390,000 UGX/month bill).
- Turnkey installed cost about 5.0M UGX.
- Payback about 1.9 years; IRR about 51 percent; 20-year NPV about 10.4M UGX at 15 percent.
Load basis
The analysis rides on the site load, so it is worth stating the evidence. The aggregate meter (meter_100) has now recorded five consecutive months (March to August 2026), and every month sits between 21 and 25 kWh per day:
| Month | kWh/day |
|---|---|
| April 2026 | 22.5 |
| May 2026 | 22.2 |
| June 2026 | 21.3 |
| July 2026 | 25.0 |
| August 2026 (to date) | 25.4 |
Full-month average about 22 kWh/day (~660 kWh/month), trending up as more customers connect. The meter is cross-validated against the independent sum of the 10 customer submeters to within 4 percent (ratio 1.04). The model uses a deliberately conservative 21.3 kWh/day, below the full-month average and well below the recent months, so the savings below are if anything understated. An older utility bill showed about 14 kWh/day, but it was a September 2025 period, roughly six months before the meter began logging, during earlier commissioning with fewer customers; it is not representative of the current site. A current UEDCL bill for meter U214624 would be a paper formality; the load itself is settled empirically.
Why solar and not just the battery
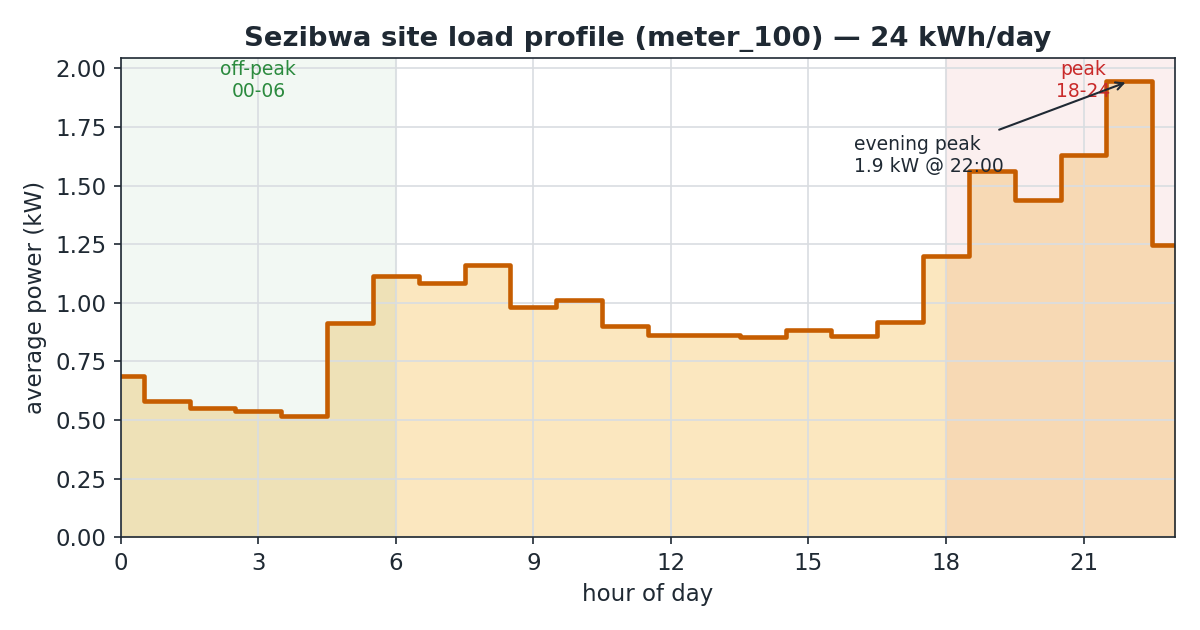
The load trough is overnight (cheap off-peak) and the load peak is the evening, inside the expensive peak tariff window (18:00 to 24:00 at 753 UGX/kWh). Solar generates midday, so the two miss by about six hours. The battery bridges the gap, but only the evening slice; the bigger win is solar serving the daytime load directly. That is why solar, not arbitrage, carries the case.
How the spill happens (why 4 kWp, not more)
Midday surplus solar has three possible homes: serve the small daytime load, charge the battery until it is full at 8.9 kWh, or export to the grid, which is not possible because Uganda has no net metering today (a policy is anticipated but not yet enacted). Once the load is served and the battery is full, extra solar is curtailed (the spill). A bigger array fills the fixed battery faster and spills more, so 4 kWp is near the point where almost nothing is wasted.
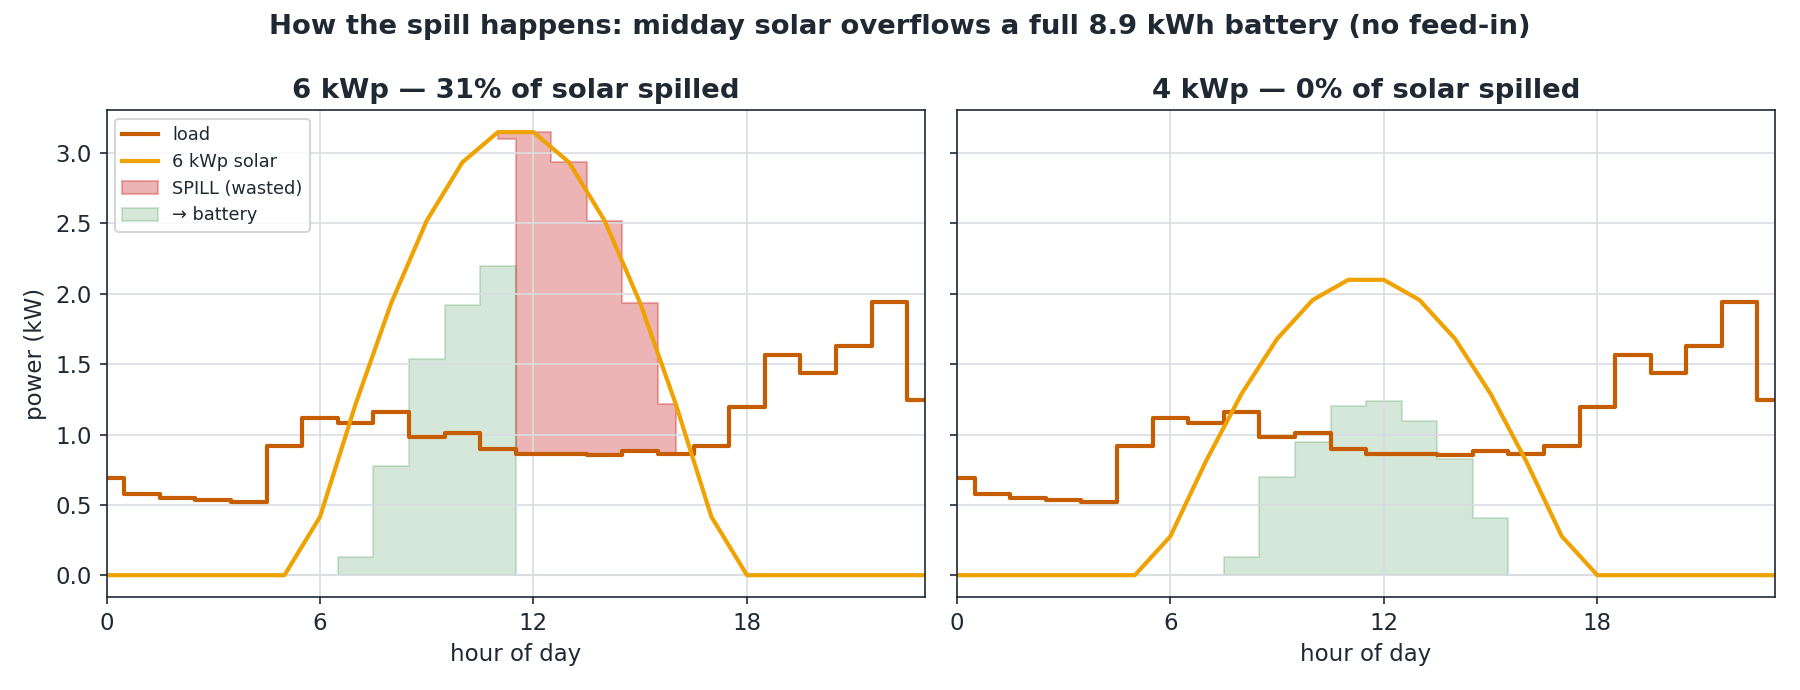
(The spill diagram is a clear-day illustration of the mechanism; the headline savings above already apply the real-weather haircut across the year.)
Capex (from the Rincol catalog)
| Basis | 4 kWp installed cost |
|---|---|
| Turnkey (bank-financed, incl. DC PV surge arrester and MC4) | about 5.0M UGX |
| At-cost floor (if NFE self-builds via Rincol) | about 4.0M UGX |
The headline uses the turnkey number. Two BOM items the catalog was missing (a DC-rated PV surge arrester and MC4 connectors) are now included.
Investment metrics (15 percent cost of capital)
| Metric | Value |
|---|---|
| Upfront cost (turnkey) | about 5.0M UGX |
| Payback | about 1.9 years |
| IRR | about 51 percent |
| ROI (20-year, undiscounted cumulative) | about 836 percent |
| NPV at 15 percent | about 10.4M UGX |
| NPV at 22 percent (commercial loan) | about 6.1M UGX |
Year-1 saving about 217,000 UGX/month; 20-year total saved about 47.2M UGX. Payback is time to recover the upfront cost; IRR is the effective annual return, and a lender funds a project when its IRR comfortably exceeds the loan rate (here 51 percent versus an 18 to 26 percent loan, a clear yes); NPV is the wealth created in today's money. The project stays strongly positive even at a 22 percent discount rate.
Battery aging over 20 years
With the battery's usable capacity fading to 50 percent by year 20 (a conservative assumption), the saving declines only gently, far less than a battery-only system which halves, because daytime solar self-consumption does not depend on the battery. Solar makes the income resilient to aging.
Related
Companion cases: Battery Arbitrage (alone), Optimal Solar and Battery Allocation, and Battery Price Break-Even. All four share the same conservative basis (turnkey capex, real weather, battery aging).