
Solar Plus Battery Economic Case (Sezibwa)
Data
[!info] Conservative, bank-facing basis (revised after two independent reviews)Tariff:UEDCL Code 10.2Q3 2026(Peak 666.5 / Shoulder 562.1 / Off-Peak 429.7 UGX/kWh). The full tariff schedule is a configurable model input, not hard-coded, so future ERA/UEDCL revisions can be evaluated without changing the model logic.Capex:turnkey installed price (what a lender finances).Generation:real day-to-day weather (seeded variable year). All three pull the numbers down from an earlier draft; these are the numbers to take to a lender. Reproducible fromnfe_solar_model.py.
Headlineprovenance
AddingUnderlying 4 kWp of solar (7 x 600 Wp) todata: the existing SRNE inverter and 8.9 kWh battery offsets about 55 percent of the site's electricity bill on the real load, current tariff and real weather. The inverter and battery are already bought (9.4M UGX sunk), so the decision is only the marginal cost of the panels.
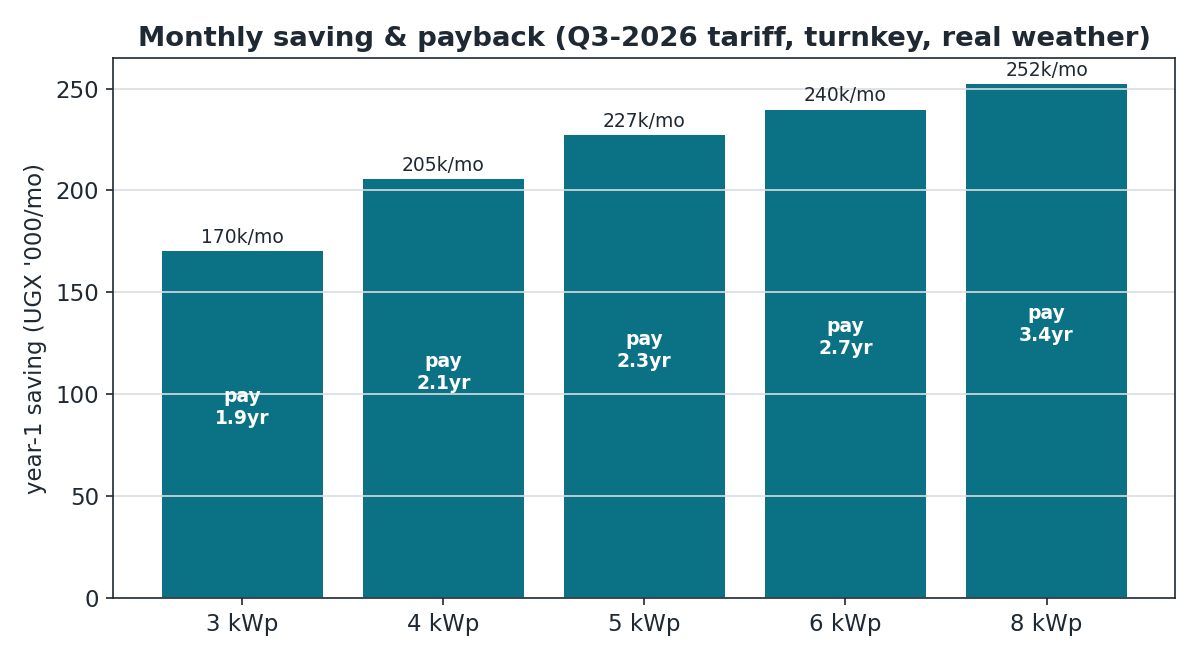
Year-1 saving about205,000 UGX per month(about 55 percent of a ~374,000 UGX/month bill).Turnkey installed cost about5.0M UGX.IRR about 48 percent; simple payback about2.1 years, discounted payback about2.7 years; 20-year NPV about9.6M UGX at 15 percent.
Load basis
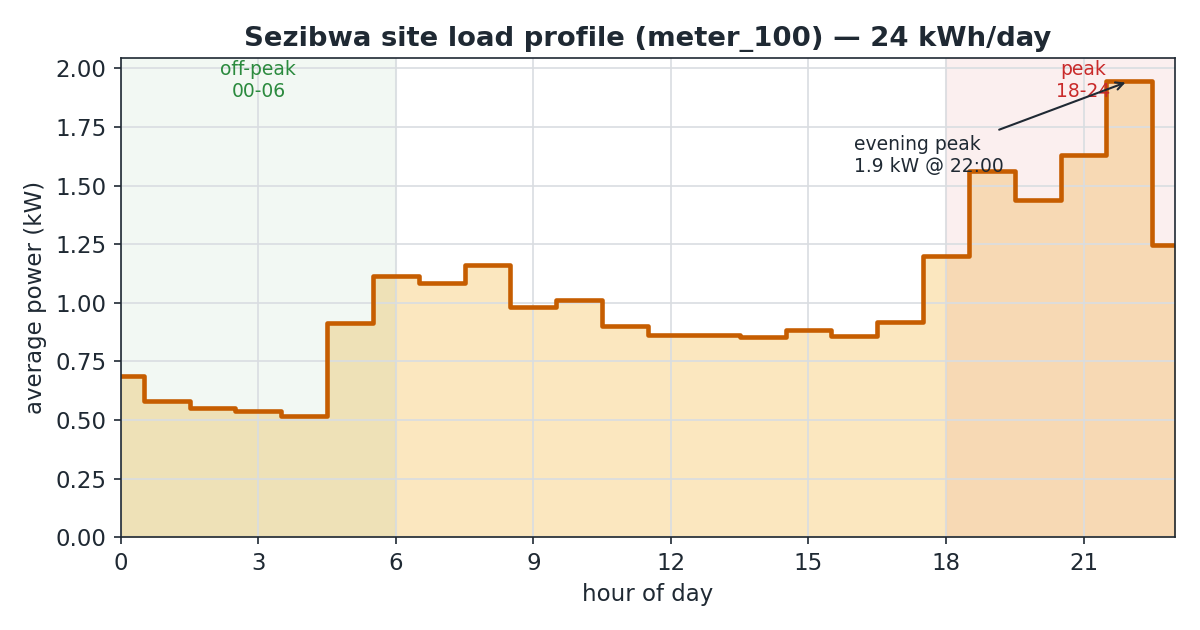
The aggregate meter (meter_100)meter_100 has now recorded five months (April to August 2026), and every month sits between 21 and 25 kWh per day:
The three complete months (April to June) average about 22 kWh/day (~660 kWh/month); July and August (partial) run higher at ~25, so the load is trending up as more customers connect. Cross-validated against the independent sum ofplus the 10 customer submeterssub-meters, over 2026-03-19 to within2026-08-10, 4from percentthe modbus energy-logger archive (ratiosources: 1.04).pi-direct Theand modelnextcloud-import), usesi.e. the pre- and early-OpenEMS period. Load basis is a deliberately conservative 21.3 kWh/day, below even the full-month average, so the savings are if anything understated. An older bill showing ~14 kWh/day is a September 2025 period, six months before the meter began logging, and is not representative of the current site.day.
Why solar, and how much
The load trough is overnightNote (cheap off-peak) and the load peak is the evening, inside the peak tariff window (18:00 to 24:00 at 666.5 UGX/kWh). Solar generates midday, so the two miss by about six hours. The battery bridges the evening slice; the bigger win is solar serving the daytime load directly.
Midday surplus past a full 8.9 kWh battery is curtailed (spilled), because there is no economically usable export for Sezibwa today (see the net-metering note below). A bigger array fills the fixed battery faster and spills more.
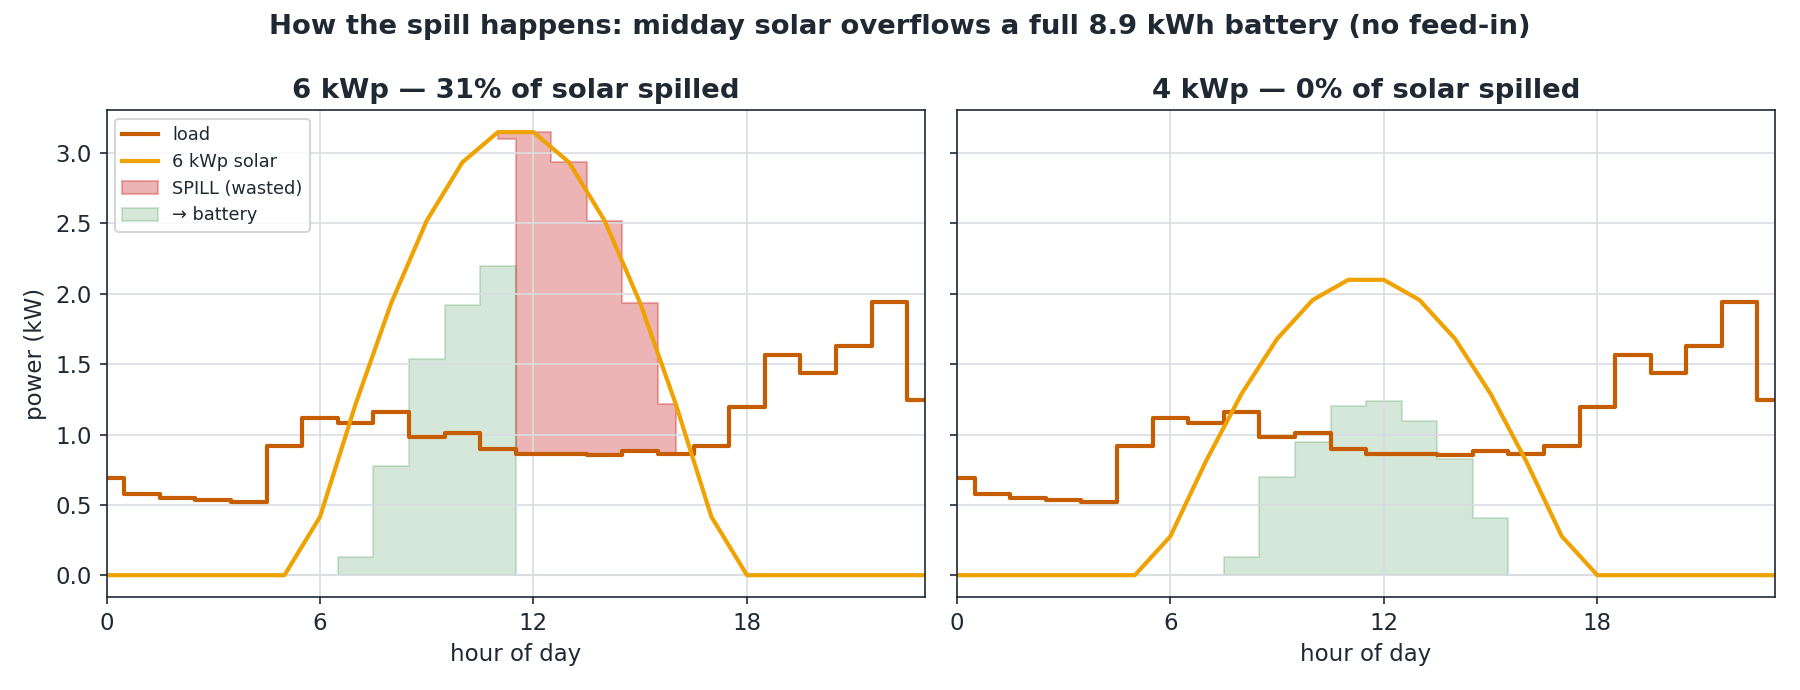
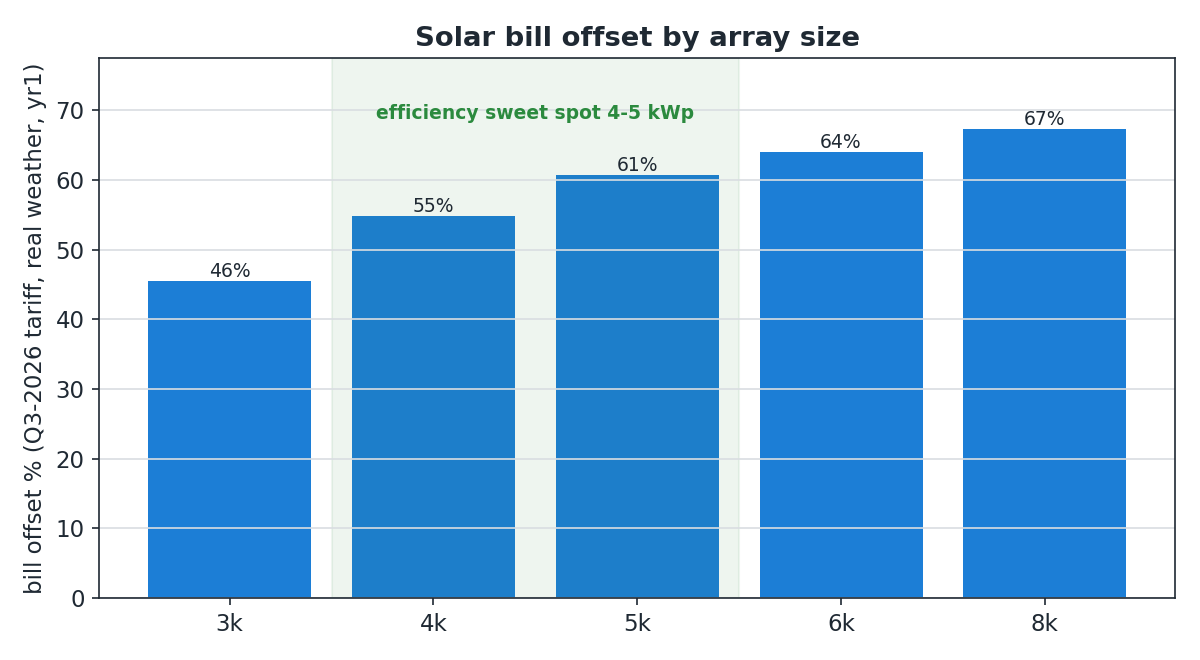
[!note] 4 kWp versus 5 kWp — two different questions, not a contradiction 4 kWp is theefficiencysweet spot: it offsets ~55 percent of the bill while curtailing almost nothing. 5 kWp is thefinancial NPV optimum(see the optimal-allocation case)2026-08-20): thefifth kWp still spills a little, but its useful generation is worth slightly more than its marginal cost, so total NPV is marginally higher. Minimising curtailment and maximising NPV are different objectives; both conclusions are correct.
[!note] Sezibwa export-value base case ERAsite haspublishedsincethemigratedElectricity (Net Metering) Regulations, 2024, so an export framework exists in principle. But eligibility for this site, the interconnection process, and the credit value are unresolved, and net-metering credits typically pay well below retail. The base case therefore assumestono economically usable export for SezibwaOpenEMS, which iswhy surplus is curtailed rather than sold.
Capex (fromnow the Rincollive catalog)
source. Investment metrics
Ranked as an investor reads them (NPV and IRR first; cumulative ROI last because it is undiscounted):
IRR isdays the effectivecustomer-meter annual return; a lender funds a project when its IRR comfortablysum exceeds the loanaggregate), rateso (herethey 48are percenttreated versusas ana 18data-quality issue to 26resolve percentbefore loan).use; Thethis NPVanalysis stays clearly positive even at a punishing 25 percent cost of capital, so the case does not depend on cheap money.
Battery aging over 20 years
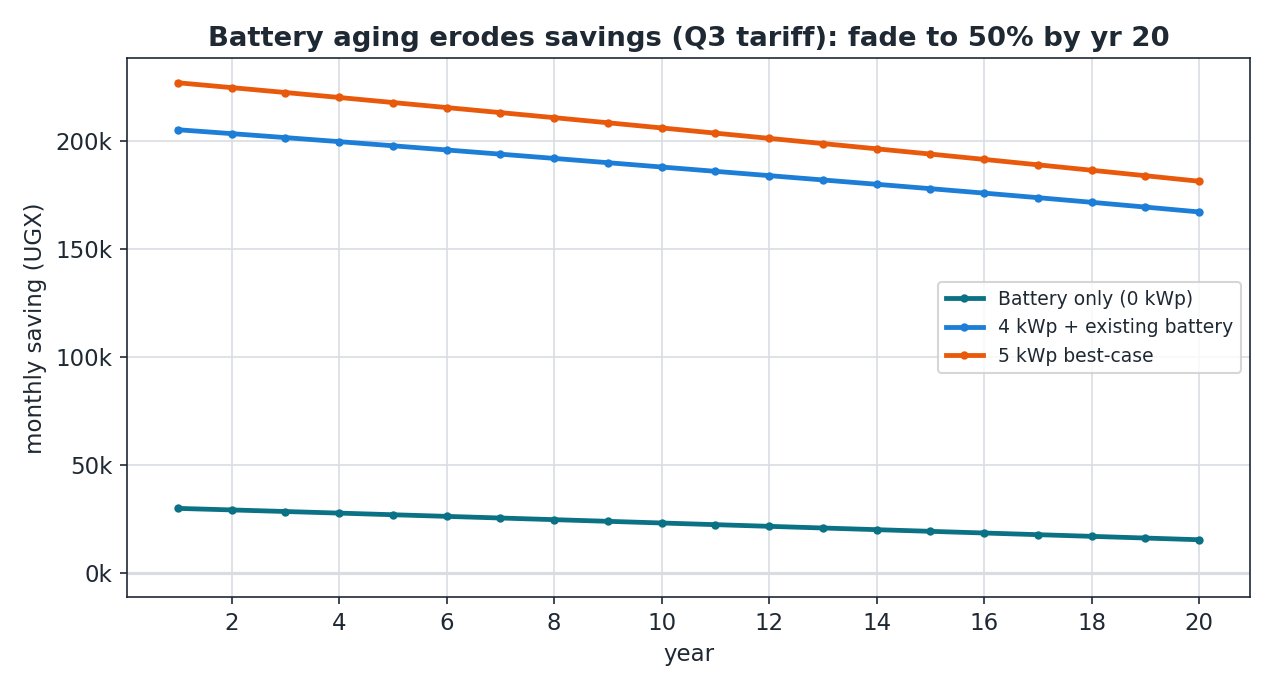
With the battery's usable capacity fading to 50 percent by year 20 (conservative), the saving declines only gently, far less than a battery-only system which halves, because daytime solar self-consumption does not depend on the battery.validated Solararchive. makesPhase assignments reflect the incomewiring resilientas observed up to aging.about (AMay battery2026 replacementand strategyshould isbe discussedre-verified inagainst the optimal-allocationcurrent case;OpenEMS thesetup existingif batteryany hereconnections ishave sunk,been so its fade is a maintenance question, not part of this investment.)changed.
Related
Companion cases (same basis): Battery Arbitrage (alone), Optimal Solar and Battery Allocation, Battery Price Break-Even.